
Table of Contents
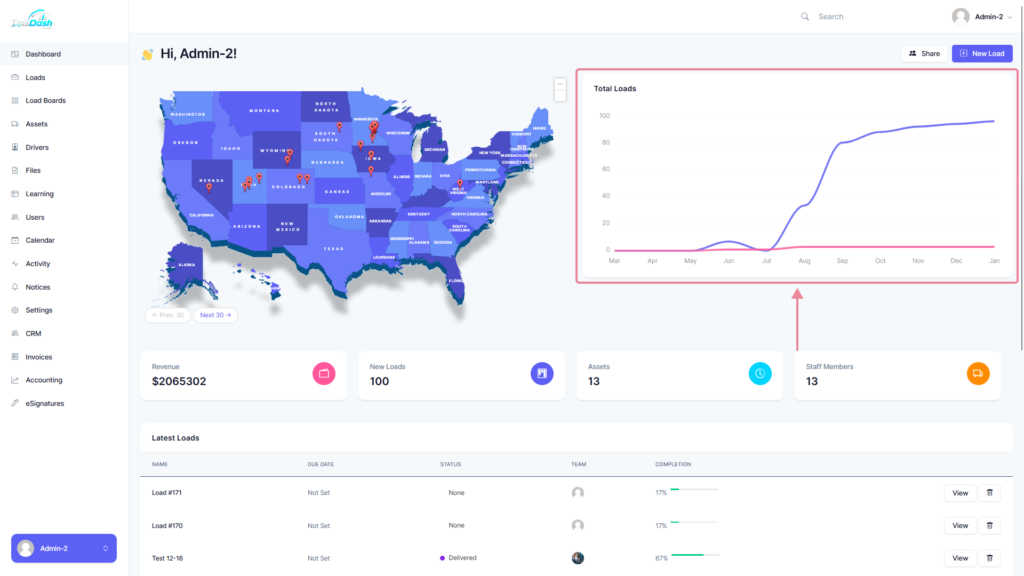
The dashboard contains important information and stats about all loads and assets.
Map #
This map will show all the loads that were created.

Total Loads #
This section will display a graph that shows the total loads over the months.
- Red Line – Shows the loads that are finished
- Blue Line – Shows ongoing loads
Stats #
- Revenue – Shows the total revenue, which is the sum of all the rates from each load
- New Loads – Shows amount of new loads added
- Assets – Shows the amount of assets that are created
- Staff Members – Shows the total number of staff member’s
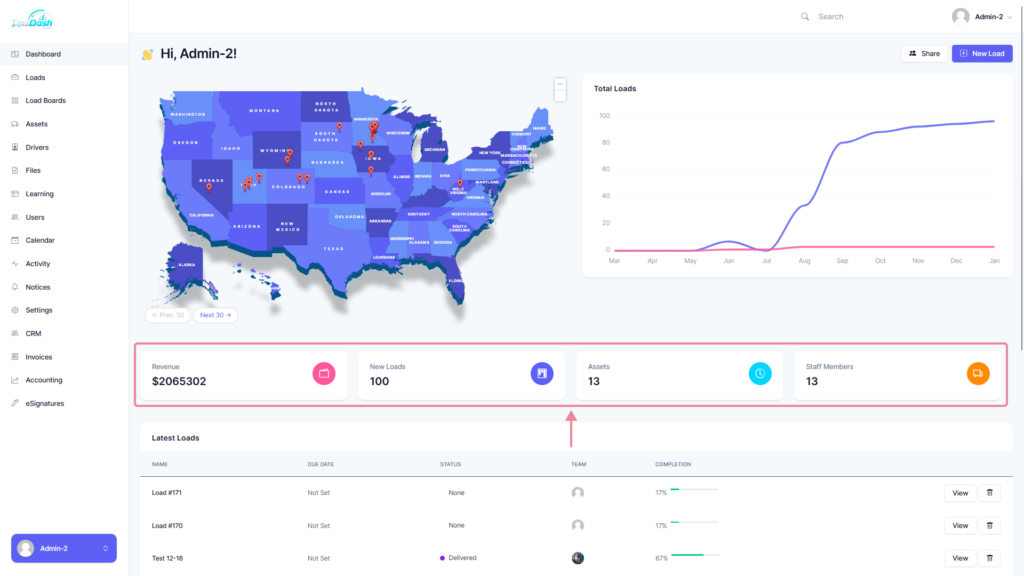
Clicking on any of the stats allows you to view them.
Latest Loads #
This section will display all the loads that were recently created.
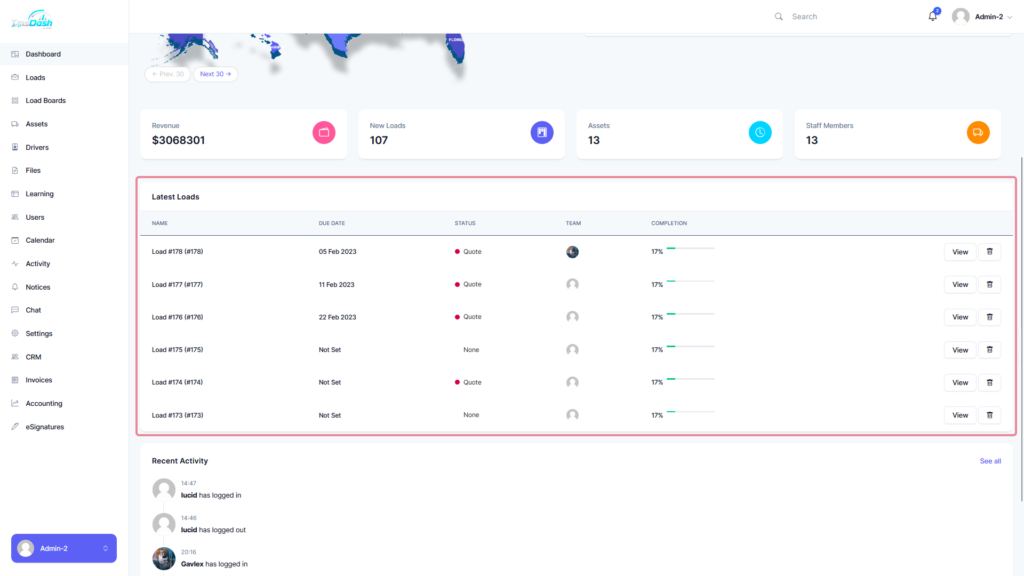
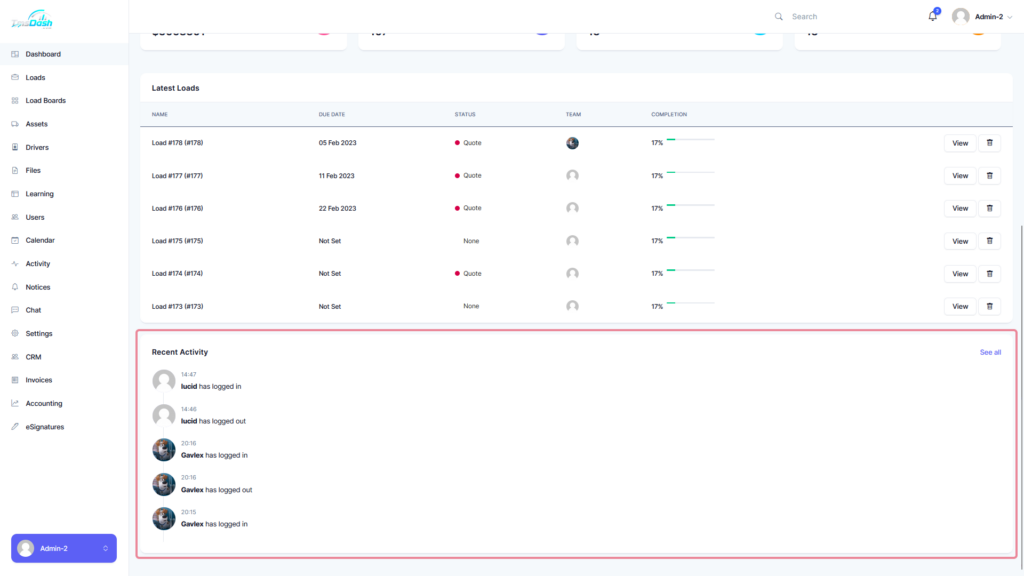
Recent Activity #
This section displays recent member activities such as logging in, updating loads, comments on loads, and more. To view all activities, click on the “See all” option in the top right corner of this section to access the Activity page


Responses