Billing Insights — collections analytics in TMSDASH
Billing analytics that turn your invoice history into collection performance. Filter by time range (7d, 30d, 90d, YTD) and visualize billing activity, payment velocity, overdue rate, outstanding balances by status, and the customers carrying the most receivables.
Overview
Billing analytics that turn your invoice history into collection performance. Filter by time range (7d, 30d, 90d, YTD) and visualize billing activity, payment velocity, overdue rate, outstanding balances by status, and the customers carrying the most receivables.
How to get there
Key features
- Time-range filter: 7 days, 30 days, 90 days, or year-to-date
- KPI cards: total billed, collected, outstanding, and overdue rate
- Billing activity trend chart over the selected range
- Payment velocity (days-to-pay) bar chart
- Outstanding balances by status (draft, sent, partial, overdue)
- Top customers by outstanding receivables table
Step-by-step
- 1Open the sidebar → Finance → Invoices, then open the Insights tab.
- 2Pick a time range (7d / 30d / 90d / YTD) at the top-right.
- 3Read the KPI cards for total billed, collected, outstanding, and overdue rate.
- 4Inspect the billing activity and payment-velocity charts for trends.
- 5Check the outstanding-by-status breakdown and the top-customers table to prioritize collections.
Page preview
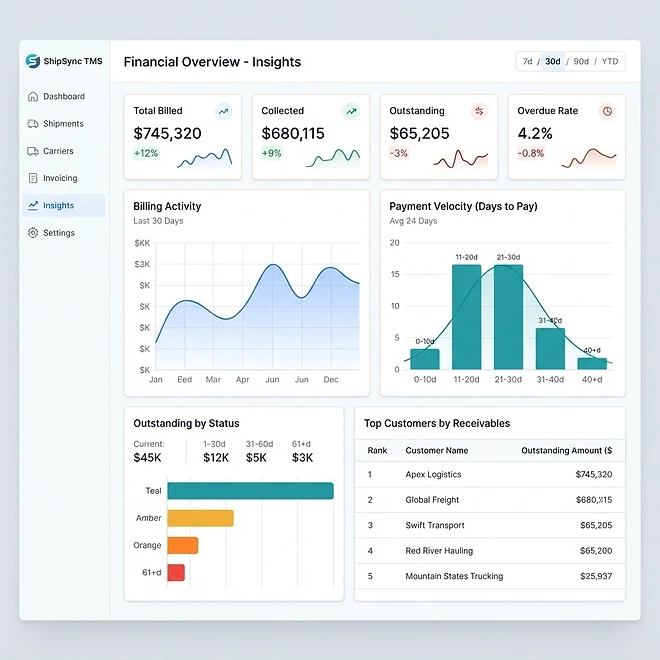
Representative screenshot of the Billing Insights page.
Was this helpful?
Related modules
Per-load profitability analysis that weighs load revenue against fuel and logged expenses, so you can see which lanes and customers are actually making money.
Calculates payroll earnings per driver from completed loads. Each driver can carry a default pay method (percent, per-mile, hourly, or flat) and rate set on their record, and individual loads can override it. You can also set a global method and rate for the report, with date-range filtering and PDF export. Now a tab inside Drivers.
Ranks drivers by revenue generated from delivered loads, with performance metrics to help you reward top performers and coach underperformers. Now a tab inside Drivers.
A fleet reporting dashboard that analyzes completed loads, estimated fuel usage, and logged per-load profitability, with summary metrics, charts, and detailed tables.
Ready to put it into practice?
Start your free trial and explore this module with your own data.